Category Archives: Failure Analysis

Propane Valve Malfunction Examples

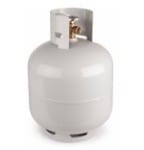
For approximately twenty years, home-use propane cylinders have been equipped with valves that contain six very important safety features:

1. Gas service valve to manually open and close the flow path from cylinder to appliance.
2. Pressure relief valve which vents a small amount of gaseous propane if the internal cylinder pressure exceeds a safe value (to prevent catastrophic cylinder rupture).
3. Bleeder valve (+ dip tube) to provide visual indication (white mist) during filling when liquid propane level inside the cylinder reaches its safe upper limit (i.e., overfilling is imminent).
4. Overfill protection device (OPD) which functions to halt liquid inflow to a cylinder when liquid propane level inside the cylinder reaches its safe upper limit.
5. Automatic shutoff valve which prevents gas flow out of the cylinder when the hose to the appliance is not fully connected to the cylinder nozzle.
6. Excess flow valve which halts propane flow out of the cylinder when the flow rate is excessive (e.g., after a catastrophic hose failure).

This author has investigated multiple cases where propane releases and flash fires were caused when the safeguards failed to function as they were intended.

The underlying hazards that create the need for the safeguards are:
1. Gas service valve. The user should be able to exercise control over the flow of propane to the appliance.
2. Pressure relief valve. The cylinder may be subjected to excessive internal pressure for either of two reasons: (a) if the cylinder is overfilled at room temperature and is later exposed to mildly higher temperatures (+25 degrees F or higher), the propane liquid can expand and create unsafe internal pressures; or (b) if the cylinder is filled to a safe level (i.e., approximately 20% vapor space above the liquid) and is later subjected to excessive heating from a fire, the liquid+vapor mixture can reach an unsafe pressure. In either case, the pressure relief valve’s job is to reduce the internal pressure by venting a small amount of the propane vapor until the internal pressure declines to a safer level. This safeguard helps prevent internal pressures that can cause the cylinder to rupture catastrophically.
3. Bleeder valve (+ dip tube). The bleeder valve and dip tube help the filling attendant visibly see when the liquid propane level in the cylinder has reached its maximum safe level (see 2 above). When the tiny stream of propane exiting the bleeder valve during filling changes from transparent vapor to a white mist, the maximum safe liquid level has been reached and the attendant is warned to stop the filling operation immediately.
4. Overfill protection device (OPD). The OPD is an automatically-actuated valve that is intended to achieve the same outcome as the bleeder valve (i.e., prevention of overfilling the cylinder with liquid), albeit without human intervention. The OPD comprises a toilet-tank style float inside the cylinder that closes off the flow path for liquid to enter the cylinder from the filling pump when the desired safe liquid level (see 2 above) has been reached.
5. Automatic shutoff valve. The Automatic shutoff valve (ASV) is a poppet-style valve that is intended to prevent the flow of propane vapor out of the cylinder until the connector nut has been fully tightened to a gas-tight sealing condition. In principle, an engagement tab inside the connector doesn’t engage the ASV’s spring-loaded isolation component until a satisfactory seal is made between the cylinder nozzle and the threaded connector nut. This is a feature that prevents gas flow out of the cylinder if the service valve is accidentally opened during storage or at any time before the appliance connection is made.
6. Excess flow valve. The Excess flow valve prevents or minimizes propane flow under circumstances where the connector is properly sealed but a downstream component (e.g., hose) fails in a way that fuel may be released to the environment instead of the appliance burner. The feature that carries out this function is a spring-loaded sphere that is normally positioned to permit a normal flow of propane vapor but is relocated to a position where the flow orifice is obstructed by the sphere when the drag force on the sphere exceeds the spring force (i.e., when flow velocity is high).

The subject safeguards (applicable to 20 lb propane cylinders) are described and specified in the CGA V-1 document “Standard for Compressed Gas Cylinder Valve Outlet and Inlet Connections”, specifically under connection style CGA 791.

While there is no doubt that the CGA 791 design has prevented numerous propane releases and injuries since it was first promulgated in 2000, this investigator believes it is inferior in one important way to the CGA 600 design that is currently approved only for small (1 lb) propane cylinders. The inferior feature involves the sealing geometry (radial versus axial) in the two designs, and the 791 design inherently provides a lower level of sealing certainty than the 600 design.

This investigator has opined that the 791 design’s inferior feature constitutes a safety defect if the resultant sealing inadequacy leads to a dangerous release of propane that causes personal injury or property damage.

The purpose of “Investigation Anecdotes” is to inform our readers about the intriguing field of engineering investigations. We hope you are instructed by this content, and we encourage you to contact us if you seek additional information.


Tire Failure Causes RV Fire

As farfetched as it sounds, this author investigated a Recreational Vehicle (RV) fire where the cause was tire failure. Consider these facts:

  • RV being operated on highway when right-front tire blew out.
  • Driver pulled over to right side of highway.
  • Witnesses photographed active fire at right-front corner of RV.
  • Fire damage to RV included near-complete melting of right-front aluminum wheel hub, with zero melting of the other five aluminum hubs.
  • Burn patterns on RV exterior indicated a low point of burning at right-front wheel well, and V-like patterns rising upward and spreading outward from there.

While the facts above are fully consistent with a fire origin at or near the right front wheel well, and no other origin location would be equally consistent, the evidence above fails to provide direct evidence of any fire causation mechanism. To discover the cause of the fire, our team found and inspected an exemplar RV of the same make and model and discovered an entirely new set of facts about the RV design – none of which survived the fire.  Consider the inset photo below and the following additional facts:

  • Several sources of combustible plastic and rubber were present inside the wheel well.
  • A set of four conductors (two of which were 10 AWG solid copper wire) inside a plastic wire loom was run through the wheel well.
  • The heavy-gauge wires provided power to the front passenger seat adjustment motor and were energized whenever the ignition key was in run or accessory mode.
  • The wire loom and wires were a few inches above the tire’s upper surface and a few inches inward from the tire’s inward edge.
  • When a rotating tire fails, elements of steel belting can partially disengage and whip around repeatedly at high speed, impacting softer materials within their reach.

Thus, after inspecting the exemplar, our team was able to supplement the burn pattern information with design information that confirmed a source of ignition (energized conductors with contemporaneously-damaged insulation) with several sources of fuel (plastic, rubber and plywood) in the area of origin.  Our causation scenario was the only hypothesis under consideration that was fully consistent with all of the facts – tire failure, followed by steel-belt whipping and damaging energized conductors, followed by ignition of nearby combustible plastics, followed by fire spread to right-front corner of RV structure.

The purpose of “Investigation Anecdotes” is to inform our readers about the intriguing field of engineering investigations.  We hope you are instructed by this content, and we encourage you to contact us if you seek additional information.


Self-Destruct Mode

Many people my age will remember the television show Mission Impossible from the late 1960s. At the very beginning of each episode, the lead character, Jim Phelps (played by actor Peter Graves) and his team of secret agents would receive a new mission from headquarters, and they would have 60 minutes (of TV time) to execute it in the face of all sorts of obstacles. The instructions and background information for the Impossible Mission Force team were always provided in a large brown envelope and a reel-to-reel audio tape player. At the end of the tape, the voice would always say, “This tape will self-destruct in five seconds. Good luck, Jim.” The tape player would suddenly start smoking and you would see the tape warping and melting as it succumbed to the mysterious fuming and heating. It almost seemed that the device was undergoing spontaneous combustion.
If you think about it, self-destruction is the essence of spontaneous combustion, but spontaneous combustion is not limited to items that have outlived their usefulness. In fact, when spontaneous combustion occurs, it almost never happens because someone intended for the material to be incinerated.
Regardless, the nagging question about spontaneous combustion not how, but why would the material survive for years or decades without undergoing self-ignition, and then one day, its surroundings change and its own tendency to undergo self-heating chemistry launches its voyage toward self-ignition and self-destruction? To paraphrase James Carville, “…It’s the environment, stupid.”
The classic scenario for enabling spontaneous combustion is filling a waste basket with linseed oil-soaked rags and waiting 3 to 12 hours. Linseed oil, like most vegetable oils, contains oxygenated hydrocarbon and these constituents continuously undergo exothermic reactions. Thankfully, the reaction rate is so slow that under normal conditions, the (neat) oils naturally dissipate such heat through conduction and convection and the liquid never warms up or approaches thermal runaway.
Conversely, when a film of the same oil is adhering to the woven interstices of cloth rags accumulated into a pile, the self-heating reactions occurring at the center of the pile deposit their heat into a space that is well insulated from the surroundings, and the heat loss is minimal. This allows the temperature to rise locally, which causes the reaction rate to grow exponentially, and eventually thermal runaway is reached. At that point, the limitation on how much longer it will take for the material to begin smoldering and to ultimately ignite is governed by the ability of fresh air to diffuse through the openings in the rags and to provide oxygen to the reacting organic material at the center of the pile.
NFPA cites the following statistics about spontaneous combustion or chemical reaction caused fires: average of 14,070 fires per year between 2005 and 2009, including 3,200 structure fires, 1,150 vehicle fires, 5,250 outside non-trash fires, and 4,460 outside trash or rubbish fires. The following are known to be capable of spontaneous combustion: Activated carbon, Oily cotton, Paper, Seed cake, Celluloid scrap, Linen stacks, Log piles, Coal piles, Haystacks, Compost piles.
Agricultural raw materials and food or feed products are very likely to undergo spontaneous combustion – especially if they are being heated in an oven or dryer. NFPA 61 states: “Spontaneous ignition is a primary cause of dryer fires and explosions. The requisites of this phenomenon are a heated surface or a hot airstream, a layer of product exposed to this heat, and time.” The four factors that make spontaneous ignition more likely are: (a) size of pile and effectiveness of self-insulation; (b) temperature of surroundings; (c) ability of oxygen to diffuse to the reaction zone; (d) sufficient time for self-heating reactions to accelerate.
Unfortunately, safe handling of linseed oil-soaked rags is not entirely intuitive, and spontaneously ignited fires continue to occur via many different scenarios. Warning labels on cans of linseed oil state: “USE EXTREME CAUTION. Immediately after use and before disposal or storage, you MUST (1) hand-wash rags thoroughly with water and detergent outside in a bucket and rinse. Repeat washing and rinsing until you have removed all oil from all cloths, rags, paper, … and any other materials contacted during use or because of an accidental spill. (2) spread all rinsed materials outside to dry by flattening them out to their full size in an airy spot for at least 24 hours until completely dry.”
This author has investigated fires where spontaneous combustion was the only likely ignition source and others where allegations of spontaneous combustion were proven incorrect upon further investigation.
The purpose of “Investigation Anecdotes” is to inform our readers about the intriguing field of engineering investigations. We hope you are instructed by this content, and we encourage you to contact us if you seek additional information.
spontaneouscombustible_4-2
haybale-spontaneous-combustion


Boiler Purge Causes Explosion

During a recent explosion investigation, this author discovered a new failure mode that is not sufficiently addressed in NFPA’s trio of industrial heating equipment standards (NFPA 85, NFPA 86, and NFPA 87) that cover Boilers, Ovens, and Fluid Heaters, respectively. The failure mode occurs only in heating systems equipped with natural gas burners and flue gas recirculation (FGR) for control of NOx emissions. The investigation where the failure mode manifested itself happened to be concerned with a boiler explosion, but ovens, furnaces, and fluid heaters are equally capable of experiencing the same problem, if certain factors are in play.
The schematic below identifies the primary equipment that plays a role in the incident scenario. In addition to the boiler, burner, blower and natural gas source, there are two flow valves (FV-001 and FV-002) that control the amount of FGR blended with fresh air that enters the burner. On smaller boilers, FV-001 is set manually during commissioning to approximately 50% open and rarely changed, whereas FV-002 is typically an automatic valve with two discrete positions – closed (no recirculation) and normal (standard recirculation).

Schematic of Boiler with FGR

NFPA burner safety requirements require a pre-ignition purge at the beginning of each burner startup to help ensure the combustion chamber is free of residual fuel gas or any other combustible vapor. NFPA burner standards have included a purge requirement for at least 50 years and such requirements have reduced the rate of explosions significantly.
The goal of the purge cycle is for approximately 4 volumes of fresh air to be admitted into the combustion chamber to drive out any unwanted combustible gas or vapor. For example, if the combustion chamber has a volume (𝑉 = 100 ft3) and the blower is delivering a flow rate Vdot = 400 acfm the purge time should be 𝑡 =1.0 min. This amount of purge is almost always conservative enough to ensure combustible vapors are diluted to a nonflammable concentration in the firebox. The very first volume of fresh air purge in theory is enough to remove the combustible vapors if a plug flow model is assumed for the air flow inside the chamber. The requirement for 4 purge volumes arises from the fact that the plug flow model isn’t conservative enough if plug flow behavior is not achieved. Hence, a perfectly-stirred vessel model is used instead. The decay of fuel concentration in the firebox is exponential with time, and 4 volumes of purge air will take a 50% fuel concentration down to 1%.
However, if the purge air isn’t comprised of pure air, but rather a mixture of “flue” gas with a high concentration of unburned fuel from the prior unsuccessful burner ignition attempt, the purging process is much slower. The figure below shows the difference in decay rates between the normal case, where the purge air is 100% air, and the compromised case, where the purge air comprises 50% FGR (with residual fuel) and 50% fresh air. When purge is carried out with contaminated air, the number of purge volumes required is 8, not 4.
PSR decay rate with contamination in purge air

For the boiler explosion case described above, this author found that FV02 had been unplugged from its power source and the damper was stuck in a partially open condition. After 3 unsuccessful ignition trials in rapid succession, the spark igniter set off an internal deflagration that damaged the vessel walls such that a complete replacement of the boiler was required.


Restaurant Staff Stays Cool, Causes Fire

Restaurants are relatively frequent victims of accidental fires. Each year, nearly 1 in 100 eating and drinking establishments experiences a fire loss and 57 percent of those fires are caused by cooking equipment (see http://www.nfpa.org/~/media/files/research/nfpa-reports/occupancies/oseating.pdf?la=en). However, the primary factor in determining fire extent and fire damage is often the status of the exhaust system – how well it was designed and installed, and how clean it has been kept.

NFPA 96 “Standard for Ventilation Control and Fire Protection of Commercial Cooking Operations” (http://www.nfpa.org/codes-and-standards/all-codes-and-standards/list-of-codes-and-standards?mode=code&code=96) enumerates dozens of design and maintenance requirements whose intent are to reduce the likelihood of fire initiation and reduce the extent and magnitude of fire damage.

Grease (from cooking operations) is a combustible semi-solid and will accumulate on exhaust system surfaces, even if a well-designed hood and grease removal apparatus is in place. Exhaust duct cleaning is required by NFPA 96 at a frequency that depends on cooking volume. Also, a new standard has been published by the International Kitchen Exhaust Cleaning Association (ANSI/IKECA C-10 “Standard for Cleaning of Commercial Kitchen Exhaust Systems”, see http://www.ikeca.org/news/ansiikeca-c-10-standard) that focuses on inspections, cleaning technologies, and client reporting. Together, these standards provide an authoritative framework for avoiding fires, and for minimizing damage if one should occur accidentally.

One of the requirements in NFPA 96 is “Cooking equipment shall not be operated while its fire‐extinguishing system or exhaust system is nonoperational or otherwise impaired.” Impairment of the exhaust system can arise from any of several maintenance lapses or installation defects (e.g., exhaust fan failure, plugging of exhaust system passageways by accumulated grease, and breaches in the exhaust ductwork where air can infiltrate).

This author investigated a very large fire loss that originated in the basement kitchen of a 10-story hotel, and exhaust system impairment was a major factor. Through interviews, inspections, and analyses, the investigation team discovered the following:
• The kitchen staff had complained of smokiness and uncomfortably high temperatures in the cooking area a few weeks before the fire.
• The fan was determined to be working properly.
• The grease extraction system (type: “water wash”) was heavily laden with grease, and likely had never been serviced by the hood manufacturer since it was installed nearly 20 years prior to the fire. (NFPA 96 requires the owner to engage a trained and certified technician for mechanical system maintenance. This requirement typically excludes the cleaning contractor.)
• The cleaning contractor couldn’t access the internals of the water wash system and several other duct spaces, so they only cleaned the accessible areas of the exhaust system.
• The cleaning contractor was tasked by restaurant management to perform a special cleaning about a week before the fire, ostensibly to find and remove the grease obstruction. Upon arrival, the contractor found one cleanout hatch wide open, and one-half of the two-piece hatch cover assembly missing. Per his custom, he only cleaned accessible areas, and tried to close the cleanout opening with the compromised hatch cover. He reported the missing hatch cover piece to management but was unaware of the major grease accumulation that remained inside the water-wash hood.
• After the fire, at one of the evidence inspections, the investigation team discovered the second half of the hatch cover assembly inside the water-wash hood, directly below the cleanout port where it should have been installed.

Cleanout2Based on these facts, this author concluded that on the day of the fire (and probably each of the other days since the special cleaning had been performed one week before), the cooking staff had removed the remaining half-cover of the cleanout in order to improve their working conditions in the kitchen. We reached this conclusion in spite of the fact that none of the chefs admitted doing so.

We developed a numerical model to determine how badly the open cleanout port would “impair” the exhaust system, and estimated that with the cleanout port wide open, the flow through the water-wash hood would drop by almost 40% and the flow into the open cleanout port would exceed the hood flow by more than 25%. This would have had the desired effect of cooling the staff’s working environment, while simultaneously compromising the effectiveness of the grease removal device and permitting grease to enter the exhaust duct unabated.

Most importantly, the burn patterns (and some witness statements) indicated the fire actually originated in the duct near the open cleanout port (i.e., downstream of the water-wash hood) and the most likely cause of ignition was a cooking ember that was sucked into the opening and landed on accumulated grease, igniting it.

The primary lessons from this incident were: (a) the cleaning contractor should have explicitly informed the restaurant that they were unable to clean the water wash hood internals; (b) the restaurant shouldn’t have expected the cleaning contractor to maintain and clean the water-wash hood, a complicated piece of machinery that they weren’t trained to service; (c) the cooking staff shouldn’t have compromised the exhaust system by opening the cleanout port, because doing so permitted the fuel (extra grease) and the ignition source (the ember) to meet in that location and initiate the fire.


Mobile Investigation Workshop

The author of this blog is pleased to announce that a new Mobile Investigation Workshop has been added to the Martin Thermal Engineering collection of tools.

The workshop is equipped with many types of hand and power tools for disassembling products and extracting evidence from a fire scene, as well as instruments that are vital to the conduct of appliance tests and exemplar examinations, including thermocouples, pressure gauges, and flow meters. Multiple video cameras with tripods can be deployed to monitor and record mechanical meters (e.g. gas volume).

We can also extract samples of automotive fluids and combustion gases for submission to an analytical lab for chemical characterization. Evidence chain of custody paperwork is maintained in a folder on board. Marking and labeling tags and signs can be employed when multiple pieces of evidence require identification.

ScattergoodMTEtransitvan

A battery charging station, complete with inverter is soon to be installed, which will make the mobile workshop self-sustaining for multi-day inspections.

The purpose of “Investigation Anecdotes” is to inform our readers about the intriguing field of engineering investigations. We hope you are instructed by this content, and we encourage you to contact us if you seek additional information.


A Spectrum of Hypotheses

Engineering investigators are obliged to utilize the “Scientific Method” when conducting an investigation into a product failure. The basic elements are: Observe, Hypothesize, Test, and Conclude.

Occasionally, an investigator will obtain sufficient information from the “Observe” phase, so that only one hypothesis is plausible. In such instances, the “Test” phase is not explicitly necessary, and the “Conclude” phase is simply a confirmation that the sole plausible hypothesis is indeed the correct understanding of the problem.

With greater frequency however, during the early stages of an investigation, the investigator is faced with two or more plausible hypotheses and it would be premature to draw a conclusion without first performing tests and analyzing the results in order to rule-in or rule-out one or more of the competing hypotheses.

Some investigations are so complex that multiple hypotheses are on the table, and the available physical evidence and eyewitness information is not sufficient for an investigator to pinpoint a “single” causation scenario, even after physical and logical tests are performed. The appropriate conclusion in such cases is “undetermined”.

So what happens when two investigators come to different conclusions – one says the evidence points strongly to a single conclusion, and the other says there are multiple hypotheses that cannot be ruled out? To which expert should a jury listen? The expert whose hypothes(es) rank high enough on the quality scale!

From this investigator’s perspective, there are eight gradations of quality from low to high that can be used to illuminate hypotheses that should be “rejected”, “avoided” or “accepted”. We have created an illustration of this scale, in the form of a color spectrum, and it is pasted below, with the levels listed subsquently as text-only.

Copyright Martin Thermal Engineering, Inc.

1. “Impossible”
2. “Contradictory Evidence”
3. “Speculation”
4. “Possible, but not Tested”
5. “Corroborating Evidence”
6. “Demonstrated Mechanism”
7. “Statistical Confidence”
8. “Proven or Certain”

As one can imagine, the last four levels (5 to 8) fall into the “Accept” category, which constitutes a “more likely than not” quality level. Levels 3 and 4 fall into the “Avoid” category – which means they can’t be ruled out, but insufficient supporting evidence is available. And finally, levels 1 and 2 apply to hypotheses that clearly fall into the “Reject” category. Collectively, the four “Avoid” and “Reject” categories constitute a “not likely enough” quality level.

As one example, consider an incident where a total of five hypotheses (“A” through “E”) have been proposed by two investigators:

Hypothesis “A” is at Level 2 – it is contradicted by some (not all) of the evidence.
Hypothesis “B” is at Level 3 – it sounds interesting, but has no basis beyond conjecture.
Hypotheses “C” and “D” are at Level 4 – they can’t be ruled out based on available data, but no validation testing has been performed.
Hypothesis “E” has supporting elements from Levels 5, 6, and 7 – the test data corroborates the hypothesis and none contradicts it; the scientific literature has published examples of similar prior incidents caused by a validated mechanism; and to a high level of statistical confidence, the hypothetical mechanism couldn’t have been caused by random variations alone.

In this situation, the five hypotheses (A to E) are not equal, so even though none of the five is officially “ruled out”, a conclusion of “undetermined” would be WRONG. In fact, only one of the hypotheses draws all of its support from the “Accept” category and no support at all from the “Avoid” and “Reject” categories.

Hypothesis “E” is the correct “more likely than not” conclusion, based on a logical evaluation of all the data – even though strictly speaking, it doesn’t rise to Level 8 – “Proven or Certain”.

Many investigators routinely apply a grading system informally (or even subconsciously) to such lists of suggested hypotheses in a given case. The spectrum presented here is simply a formalized representation of such systems that, at their core, comprise large doses of common sense.

The purpose of “Investigation Anecdotes” is to inform our readers about the intriguing field of engineering investigations. We hope you are instructed by this content, and we encourage you to contact us if you seek additional information. Copyright Martin Thermal Engineering, Inc. (2013)


Statistical Inference and Product Failure Analysis

When a consumer product fails thermally, customers may get “steamed” and demand their money back.  When the failures are frequent enough that the Consumer Product Safety Commission receives dozens of complaints about “melted plastic” and “first degree burns” a few weeks after the initial launch of the product, they may require the seller to pull the offending product from retail shelves and issue a “safety recall” notice to all consumers.  If you consider a product that is being sold at a rate of 100,000 units per month, it is easy to see how quickly the recall costs could add up.

However, the matter could become even more problematic if the supply chain involves multiple entities (e.g. a product designer, a contract manufacturer, and a marketing entity).  When the recall costs are tallied up, the manufacturer and designer could find themselves in a legal battle to determine whether the thermal failures were caused by “design defects” or “manufacturing defects”.

One particularly challenging aspect of an engineering failure investigation is to understand why only a small percentage of all the shipped products fails prematurely.  By carefully examining the failed units, an engineer may be able to identify the correct failure mode(s), but inspection alone likely will not be sufficient to determine whether the root cause was a bad design or low quality manufacturing.

After the failure mechanism is identified (e.g., loose connection or excessive current draw) the engineer should examine and test a large number of “new-in-box” units to see if there is a correlation between parts that are “out-of-spec” and parts that fail when used normally.   If brand-new parts meet the dimensional and functional requirement of the design, it’s pretty obvious that the design wasn’t adequate to prevent the overheating.  On the other hand, a finding that many of the parts don’t conform to the design dimensions (and other requirements) doesn’t definitively prove that manufacturing defects were the cause of the safety problems.

In a recent investigation of a recalled consumer electronic product, this author discovered that 80% of “new-in-box” samples did not meet the design specification…but less than 3% of the samples failed thermally when first used.  Tellingly, we also found that 9% of the samples were not only “out-of-spec”, but “grossly-out-of-spec” and that each of the samples that failed thermally fell into the “grossly-out-of-spec” category.  (Conversely, none of the 20% of the “in-spec” parts failed when used normally, which provided validation that the design was adequate.)

Using “statistical inference” we concluded that it was virtually impossible (48 chances in a billion) for all of the failed samples to come from the “grossly-out-of-spec” population if only random forces were at play – hence there must be a “causal link” between the “grossly-out-of-spec” condition and the thermal overheating result.  Statistical methods proved extremely helpful in illustrating that the manufacturing “nonconformances” were indeed the “defects” that caused the safety recall!

The purpose of “Investigation Anecdotes” is to inform our readers about the intriguing field of engineering investigations.  We hope you are instructed by this content, and we encourage you to contact us if you seek additional information.