Category Archives: Engineering Tools

Engineering tools used to help draw conclusions about engineering investigations.

Code Violation Causes Explosion

The California Mechanical Code (CMC) is one of thirteen parts of the California Building Standards Code that is adopted into law every three years by the California Legislature. The other 49 U.S. states adopt similar safety codes, which generally include the following titles (preceded by ): Building Code, Electrical Code, Fire Code, Mechanical Code, Plumbing Code, Residential Code, etc.

One of the primary objectives of the mechanical code is to help ensure that heating, ventilating, and air conditioning equipment installed in buildings are designed, operated, and maintained safely. Many HVAC systems utilize natural gas, which is highly flammable and can cause explosions.
This author investigated a natural gas explosion (also called deflagration, or subsonic combustion wave) that was caused by a series of maintenance errors, a heater malfunction, and a major code violation.

The maintenance errors caused natural gas to be released into a heater room, the code violation permitted the natural gas to accumulate in the room instead of being safely vented outdoors, and the malfunction permitted the heater to re-start automatically in an unsafe state, which ignited the explosion. Two workers received serious burn injuries from the incident, but the explosion wasn’t strong enough to damage the building.

It was difficult to rank the errors and defects according to their level of egregiousness, but the worst one was undoubtedly the combined design defect and construction defect associated with the building that housed the gas-fired heater. The heater was located at ground level inside a 23-foot tall enclosure construction from concrete masonry units (i.e., cinder blocks). The architect was responsible for the defective design, which contemplated heating equipment inside the room but didn’t incorporate the code-required ventilation area. The general contractor and appliance installer were responsible for allowing the heating equipment to be installed in the room without the proper ventilation.

The CMC requires ventilation at the top of any enclosure that houses gas-fueled appliances. The purpose is to vent natural gas (which is lighter than air) in the event of a substantial release of gas into the indoor space. Allowing flammable gas to accumulate in an enclosure is the first step in the process of forming an explosive device that lacks only an ignition source to turn into a horrific fireball or a destructive blast wave. The subject room was well sealed along the upper 75% of its height but was equipped with a louvered door at the bottom that effectively allowed combustion air into the room to supply oxygen for the heating appliance. Combustion products from the heater were vented directly to the outdoors by an electric blower, and the replacement air entered through the door louvers.

When the gas pipe developed a leak (the facts weren’t entirely clear about the size of the leak was or how it began), the gas rose to the ceiling and accumulated there, displacing the air below it to the outside environment through the door louvers.

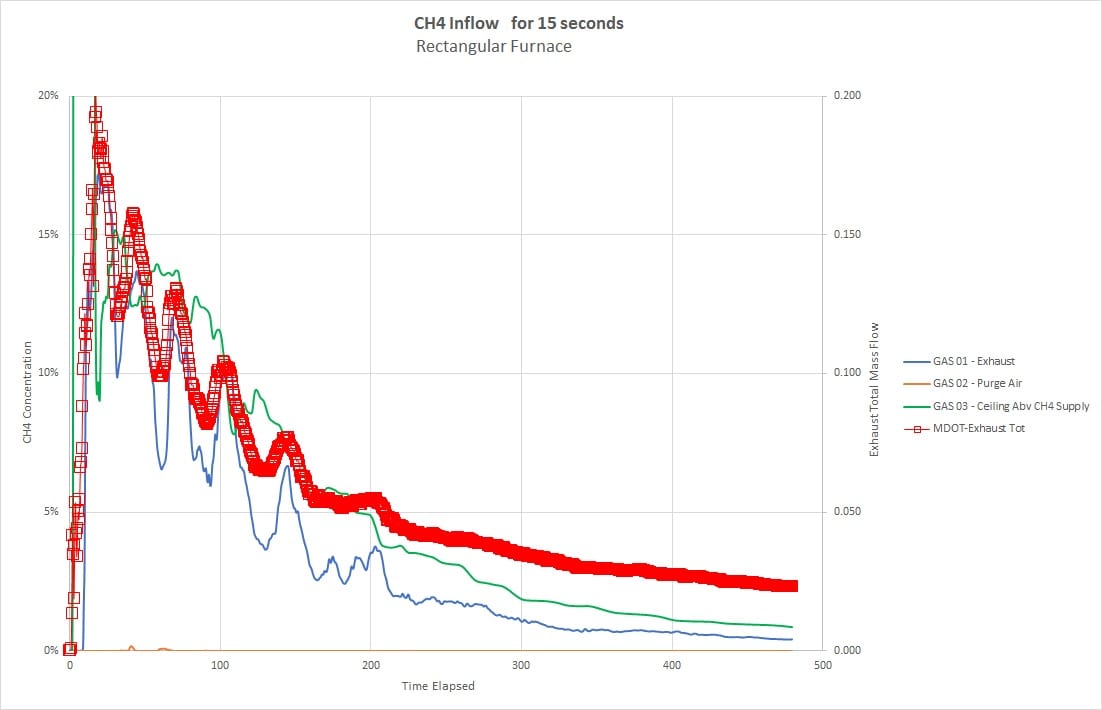
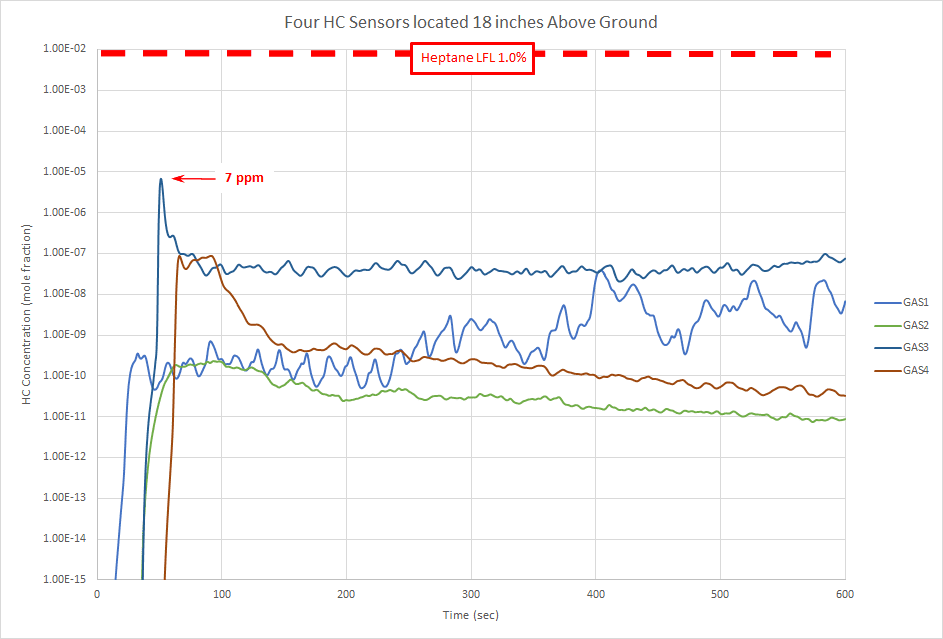
This author performed a Large Eddy Simulation (LES) of the gas accumulation phase which showed the steady-state fuel gas concentration in the upper three-quarters of the room to be substantially greater than the Upper Flammable Limit for natural gas (approximately 15 percent by volume). This fact turned out to be the sole reason the building didn’t explode – a large fraction of the fuel gas present in the room had accumulated in zones that were too rich to burn (not enough oxygen present).
Nevertheless, when the employees were instructed to enter the room and shut off the gas to the heater, their motion created a flammable zone in some portion of the lower 25% of the room’s volume. When the defective heater ignited the flammable mixture as they were exiting the room, the fireball that was created pushed flames out through the open door and burned them badly as they tried to escape. Thankfully both survived.

Posted below are two videos showing the LES simulations for Case 1 – as installed without any venting at the ceiling, and Case 2 – as required by code, with a code-compliant opening of only 150 square inches of flow area at the top of the heater room. Case 1 shows high gas concentration (red) from ceiling down to the top louver of the entry door when gas is flowing and no significant dissipation after the gas source is shut off. Case 2 shows a temporary accumulation of moderate gas concentration (green) until the gas source is shut off, after which full dissipation occurs through the upper vent. The simulation runs approximately 24x faster than real time.

This gas accumulation simulation (along with testing of the defective heater, timeline analysis of witness testimony, and plumber standard of care analyses) helped the parties reach a resolution in this case.


Purging Natural Draft Furnaces

NFPA 86 (Ovens and Furnaces) and NFPA 87 (Fluid Heaters) recognize that some industrial heating systems are installed where electricity is not available, and heaters must be operated without the benefit of a forced-draft, clean-air purge prior to startup.

Nevertheless, natural draft furnaces can be started up safely by ensuring ventilation doors and exhaust ducts are wide open for a sufficient amount of time prior to ignition. Natural draft ventilation is driven by buoyancy forces, just like the chimney effect that occurs when exhaust from a fire rises up a chimney (i.e., because “hot air rises”). The difference with pre-ignition purge is that the buoyancy forces arise from the difference in gas density of methane and air. One thousand liters of air weighs about 1.2 kilograms, whereas one thousand liters of natural gas weighs less than 700 grams. (By comparison, helium and hydrogen are even less dense, but the density of natural gas is sufficiently low to cause a natural draft purge in a reasonable amount of time.)

The purpose of purging a furnace prior to burner light-off is to remove any combustible gases from the furnace enclosure and thereby prevent accidental ignition of an accumulation of gas from a prior unsuccessful light-off or leaking shutoff valve. When forced ventilation is used, the standards require purging the enclosure with 4 volumes of fresh air prior to light-off. In other words, if a furnace enclosure is 100 cubic meters, and the forced draft fan can be proven to deliver at least 100 cubic meters of fresh air per minute, a purge duration of 4 minutes can be programmed into the startup sequence and the code requirement will be satisfied.

However, when natural draft ventilation is the only available method of purging, determining the length of time for purge is not straightforward. Without a fan, it is more difficult to determine the exhaust gas flow rate, but more importantly, the exhaust flow rate varies with the amount of residual methane still in the furnace. As the furnace becomes more diluted with air (i.e., as the purge process dilutes the initial methane concentration down to lower values) the buoyancy driving force declines, and so does the purge rate. There is no way to ensure a certain number of “fresh air purge volumes” are forced into and out of the enclosure because the volumetric flow rate changes with time.

To overcome this problem, the Section 8.5.1.2 of NFPA 86 requires the purge time to be determined by measurement, at a time when the furnace is at normal ambient temperature. The preferred method of doing so relies on combustible gas analyzers and oxygen analyzers to continuously measure the exhaust flow leaving the furnace until the concentration falls below 25% of the LFL (lower flammability limit) of the fuel gas in air.

This author has modeled the accumulation and dissipation of natural gas in a hypothetical furnace using a large-eddy-simulation software tool called Pyrosim, which is derived from the NIST code FDS (Fire Dynamics Simulator). A video showing the process for a 20 cubic meter furnace is shown here, and a plot of exhaust concentration versus time for the simulation is also shown.

Plot of CH4 concentration during natural draft purge

These results are not applicable to any furnace or gas source or combustion system other than the one modeled, and readers SHOULD NOT extrapolate these results to any other furnace or application. The ventilation rate depends strongly on the size of the openings (for exhaust gas outflow and fresh air inflow) and the time required to purge an actual furnace in the field could vary greatly from case to case. Furnace users are urged to consult with a purge specialist to determine the correct purge time for their own applications.

The purpose of “Investigation Anecdotes” is to inform our readers about the intriguing field of engineering investigations. We hope you are instructed by this content, and we encourage you to contact us if you seek additional information.


Mobile Investigation Workshop

The author of this blog is pleased to announce that a new Mobile Investigation Workshop has been added to the Martin Thermal Engineering collection of tools.

The workshop is equipped with many types of hand and power tools for disassembling products and extracting evidence from a fire scene, as well as instruments that are vital to the conduct of appliance tests and exemplar examinations, including thermocouples, pressure gauges, and flow meters. Multiple video cameras with tripods can be deployed to monitor and record mechanical meters (e.g. gas volume).

We can also extract samples of automotive fluids and combustion gases for submission to an analytical lab for chemical characterization. Evidence chain of custody paperwork is maintained in a folder on board. Marking and labeling tags and signs can be employed when multiple pieces of evidence require identification.

ScattergoodMTEtransitvan

A battery charging station, complete with inverter is soon to be installed, which will make the mobile workshop self-sustaining for multi-day inspections.

The purpose of “Investigation Anecdotes” is to inform our readers about the intriguing field of engineering investigations. We hope you are instructed by this content, and we encourage you to contact us if you seek additional information.


Large Eddy Simulation

Over the past 25 years, the National Institute of Standards and Technology (NIST) has developed, augmented and improved an important computational tool for fire investigators – the Fire Dynamics Simulator (FDS) code.

FDS is a flow, heat, and chemistry modeling application that is utilizes Computational Fluid Dynamics (CFD) to model fires and other flows that are important to fire safety engineers and fire investigators. While other commercial CFD programs exist, their cost to license and their computational cost (hours of runtime) tend to make them inaccessible for small enterprises, including many fire investigation firms.

Fortuitously, FDS offered breakthroughs on several fronts that helped bring the power of CFD modeling to smaller practitioners. (Recently, a user-friendly, front-end package was developed by Thunderhead Engineering http://www.thunderheadeng.com/ and can be licensed for a reasonable annual fee.) Because the underlying code was developed by the U.S. Government, it is downloadable and usable by the general public with no license fees. Secondly, the program can be run on Windows-based desktop and laptop computers, so there is no need to purchase expensive hardware. Perhaps most importantly, the program uses a computational simplification called “Large Eddy Simulation” (LES) to enhance the speed at which complex flows can be solved numerically.

While LES does employ a computational shortcut (where only large eddies are directly solved and the dissipative energy generation of the small eddies is modeled as a byproduct of the large eddies) as compared to CFD programs that utilize Direct Numerical Simulation (where all the equations are solved for all sizes of turbulent eddies), the LES technique nevertheless produces fully-validated results for many fire problems.

The video posted below is a FDS simulation of a gasoline leak under a car inside a garage. The model incorporates a source of heptane vapor being released from a square “puddle” under the vehicle’s engine compartment. Contours of heptane concentration versus time are shown in the simulation output – red is flammable, orange is possibly flammable, yellow is probably not flammable, and green/blue/purple are not flammable. It is noteworthy that the red contours do cover the entire floor surface, but because gasoline vapors are heavier than air, the flammable concentrations don’t rise up very high above the floor level.

Also posted below is a plot of hydrocarbon concentration measured by four sensors located in the corners of the garage, at an elevation of approximately 18 inches above the floor. The Consumer Product Safety Commission performed tests of the safety of water heaters in garages approximately 25 years ago and found that flash fires involving gasoline spills ignited by the pilot flame of a water heater were largely preventable if the water heaters were installed on pedestals so that the flames were at least 18 inches up in the air.

The plot below validates the CPSC’s finding. The maximum concentration at the four sensors during the 10 minute duration of the simulation run was 7 parts per million, by volume. This is more than 99.9% smaller (three orders of magnitude smaller) than the Lower Flammable Limit of heptane (1.0 percent by volume). In other words, the mixture is too lean to produce a deflagration at the elevation of the water heater’s burner, if the heater is installed on pedestal, in adherence with the requirements of the National Fuel Gas Code.

The purpose of “Investigation Anecdotes” is to inform our readers about the intriguing field of engineering investigations. We hope you are instructed by this content, and we encourage you to contact us if you seek additional information.

HydrocarbonSensors-GarageGasolineLeak


A Spectrum of Hypotheses

Engineering investigators are obliged to utilize the “Scientific Method” when conducting an investigation into a product failure. The basic elements are: Observe, Hypothesize, Test, and Conclude.

Occasionally, an investigator will obtain sufficient information from the “Observe” phase, so that only one hypothesis is plausible. In such instances, the “Test” phase is not explicitly necessary, and the “Conclude” phase is simply a confirmation that the sole plausible hypothesis is indeed the correct understanding of the problem.

With greater frequency however, during the early stages of an investigation, the investigator is faced with two or more plausible hypotheses and it would be premature to draw a conclusion without first performing tests and analyzing the results in order to rule-in or rule-out one or more of the competing hypotheses.

Some investigations are so complex that multiple hypotheses are on the table, and the available physical evidence and eyewitness information is not sufficient for an investigator to pinpoint a “single” causation scenario, even after physical and logical tests are performed. The appropriate conclusion in such cases is “undetermined”.

So what happens when two investigators come to different conclusions – one says the evidence points strongly to a single conclusion, and the other says there are multiple hypotheses that cannot be ruled out? To which expert should a jury listen? The expert whose hypothes(es) rank high enough on the quality scale!

From this investigator’s perspective, there are eight gradations of quality from low to high that can be used to illuminate hypotheses that should be “rejected”, “avoided” or “accepted”. We have created an illustration of this scale, in the form of a color spectrum, and it is pasted below, with the levels listed subsquently as text-only.

Copyright Martin Thermal Engineering, Inc.

1. “Impossible”
2. “Contradictory Evidence”
3. “Speculation”
4. “Possible, but not Tested”
5. “Corroborating Evidence”
6. “Demonstrated Mechanism”
7. “Statistical Confidence”
8. “Proven or Certain”

As one can imagine, the last four levels (5 to 8) fall into the “Accept” category, which constitutes a “more likely than not” quality level. Levels 3 and 4 fall into the “Avoid” category – which means they can’t be ruled out, but insufficient supporting evidence is available. And finally, levels 1 and 2 apply to hypotheses that clearly fall into the “Reject” category. Collectively, the four “Avoid” and “Reject” categories constitute a “not likely enough” quality level.

As one example, consider an incident where a total of five hypotheses (“A” through “E”) have been proposed by two investigators:

Hypothesis “A” is at Level 2 – it is contradicted by some (not all) of the evidence.
Hypothesis “B” is at Level 3 – it sounds interesting, but has no basis beyond conjecture.
Hypotheses “C” and “D” are at Level 4 – they can’t be ruled out based on available data, but no validation testing has been performed.
Hypothesis “E” has supporting elements from Levels 5, 6, and 7 – the test data corroborates the hypothesis and none contradicts it; the scientific literature has published examples of similar prior incidents caused by a validated mechanism; and to a high level of statistical confidence, the hypothetical mechanism couldn’t have been caused by random variations alone.

In this situation, the five hypotheses (A to E) are not equal, so even though none of the five is officially “ruled out”, a conclusion of “undetermined” would be WRONG. In fact, only one of the hypotheses draws all of its support from the “Accept” category and no support at all from the “Avoid” and “Reject” categories.

Hypothesis “E” is the correct “more likely than not” conclusion, based on a logical evaluation of all the data – even though strictly speaking, it doesn’t rise to Level 8 – “Proven or Certain”.

Many investigators routinely apply a grading system informally (or even subconsciously) to such lists of suggested hypotheses in a given case. The spectrum presented here is simply a formalized representation of such systems that, at their core, comprise large doses of common sense.

The purpose of “Investigation Anecdotes” is to inform our readers about the intriguing field of engineering investigations. We hope you are instructed by this content, and we encourage you to contact us if you seek additional information. Copyright Martin Thermal Engineering, Inc. (2013)


Statistical Inference and Product Failure Analysis

When a consumer product fails thermally, customers may get “steamed” and demand their money back.  When the failures are frequent enough that the Consumer Product Safety Commission receives dozens of complaints about “melted plastic” and “first degree burns” a few weeks after the initial launch of the product, they may require the seller to pull the offending product from retail shelves and issue a “safety recall” notice to all consumers.  If you consider a product that is being sold at a rate of 100,000 units per month, it is easy to see how quickly the recall costs could add up.

However, the matter could become even more problematic if the supply chain involves multiple entities (e.g. a product designer, a contract manufacturer, and a marketing entity).  When the recall costs are tallied up, the manufacturer and designer could find themselves in a legal battle to determine whether the thermal failures were caused by “design defects” or “manufacturing defects”.

One particularly challenging aspect of an engineering failure investigation is to understand why only a small percentage of all the shipped products fails prematurely.  By carefully examining the failed units, an engineer may be able to identify the correct failure mode(s), but inspection alone likely will not be sufficient to determine whether the root cause was a bad design or low quality manufacturing.

After the failure mechanism is identified (e.g., loose connection or excessive current draw) the engineer should examine and test a large number of “new-in-box” units to see if there is a correlation between parts that are “out-of-spec” and parts that fail when used normally.   If brand-new parts meet the dimensional and functional requirement of the design, it’s pretty obvious that the design wasn’t adequate to prevent the overheating.  On the other hand, a finding that many of the parts don’t conform to the design dimensions (and other requirements) doesn’t definitively prove that manufacturing defects were the cause of the safety problems.

In a recent investigation of a recalled consumer electronic product, this author discovered that 80% of “new-in-box” samples did not meet the design specification…but less than 3% of the samples failed thermally when first used.  Tellingly, we also found that 9% of the samples were not only “out-of-spec”, but “grossly-out-of-spec” and that each of the samples that failed thermally fell into the “grossly-out-of-spec” category.  (Conversely, none of the 20% of the “in-spec” parts failed when used normally, which provided validation that the design was adequate.)

Using “statistical inference” we concluded that it was virtually impossible (48 chances in a billion) for all of the failed samples to come from the “grossly-out-of-spec” population if only random forces were at play – hence there must be a “causal link” between the “grossly-out-of-spec” condition and the thermal overheating result.  Statistical methods proved extremely helpful in illustrating that the manufacturing “nonconformances” were indeed the “defects” that caused the safety recall!

The purpose of “Investigation Anecdotes” is to inform our readers about the intriguing field of engineering investigations.  We hope you are instructed by this content, and we encourage you to contact us if you seek additional information.


Photogrammetry

A fire that originated inside a restaurant in a strip mall became the subject of litigation almost three years after the date of the fire. An adjacent tenant in the mall was pursuing a claim against the restaurant owner seeking recovery for his losses.

Subsequent to the fire, but before we were retained by the adjacent tenant’s law firm, the property had been rebuilt. Consequently, it was impossible for us to perform a site inspection, but we were able to review photographs taken by the responding fire department’s arson investigator.

Every investigator will acknowledge that his level of confidence in his own conclusions is usually higher when he has had the opportunity to actually examine the site and the physical evidence. Nonetheless, good investigators can often develop strong conclusions from photographic evidence alone, as long as other available evidence (e.g., eyewitness testimony, building records, fire personnel observations) corroborates the findings.

One technique that can be especially helpful for analyzing historical photos is photogrammetry. In the subject case, we wanted to determine if an oven’s exhaust duct was properly installed (i.e., did it have sufficient clearance between the duct’s hot walls and the building’s wood beams and joists). We used photogrammetry to assess the dimensions of both items.

Photogrammetry is the art and science of determining geometric properties of objects from photographic images. The two images on this anecdote page give examples of a photogrammetric analysis conducted as part of our strip mall fire investigation. In both images, the superimposed green lines represented known dimensions and the superimposed red lines represented unknown dimensions. By computing the relative lengths of the red and green lines, a multiplier was obtained and the unknown dimensions were determined from the known dimensions.

In the first photo above, the known dimension (green line) was a 4-inch electrical junction box, and the unknown dimension (red line) was the width of the square exhaust duct (determined by the analysis to be 24 inches).

In the second photo, the known dimension (green) was a 16-inch cement block, and the unknown dimension (red) was the distance between joist hangers (also determined to be 24 inches).

The photogrammetric results were ultimately compared to eyewitness statements and burn patterns to form a sound conclusion about the origin and cause of the fire.

The purpose of “Investigation Anecdotes” is to inform our readers about the intriguing field of engineering investigations. We hope you are instructed by this content, and we encourage you to contact us if you seek additional information. Copyright Martin Thermal Engineering, Inc. (2013)